Product Overview
z/OS Code Analysis
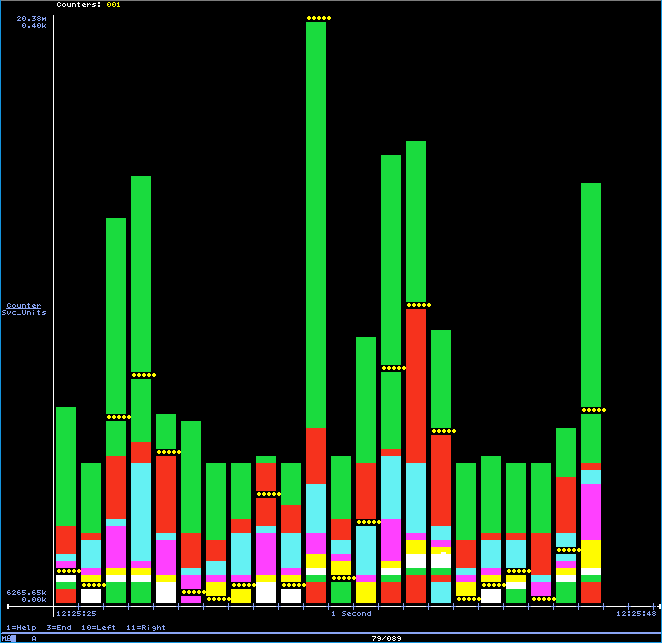
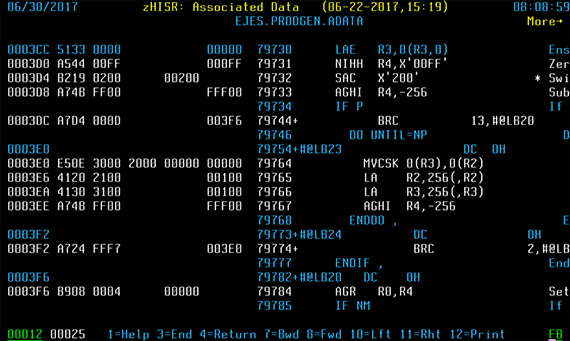
zHISR generates reports that help tune applications by locating specific sections of your code that are the biggest CPU consumers.
What is zHISR
zHISR is an application execution profiler that lets users easily interface with IBM Z Hardware Instrumentation Services (HIS) to perform near-zero overhead, high-resolution hot spot analysis of programs running under z/OS. This utility is a useful tool for software programmers, performance analysts, and systems programmers.
Specifications
Technical Specs
zHISR normalizes sample data between faster zIIP and zAAP engines and slower sub-capacity coprocessors.
When used with z/OS 2.1 systems or later, zHISR supports up to 128 concurrent collections.
zHISR uses resources efficiently and costs little to run. If zIIP specialty engines are available and zHISR is APF authorized, nearly all of zHISR CPU processing is redirected to a zIIP.
While an IBM Z processor (System z10 or later) running z/OS in an LPAR is required to provide the sampling function, the analysis by zHISR is not restricted to these environments. The sample data can be transferred to an older processor or a z/VM guest z/OS with zHISR installed.
zHISR Reports
zHISR analytic reports are based on data created by z/OS Hardware Instrumentation Services (IBM System z10 or better) and stored as UNIX files or z/OS data sets. Reports can be printed, saved to a data set, or exported in CSV format.
Other Features
File system navigation interface: Browse files and even delete them.
Memory display/alter utility: View main storage in the CPU you are logged on to.
z/Architecture instruction speed tester: Determine the relative and actual speed of over 1,000 hardware instructions.
COBOL and Assembler API: Start and stop collections from a program.
Counter data collection and analysis: Collect and analyze counter data provided by the z/Architecture CPU Measurement Facility.


